


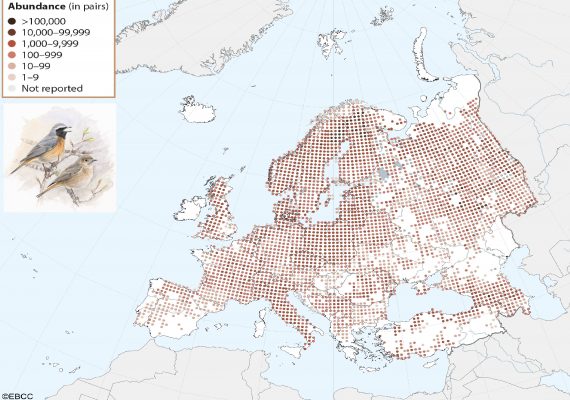
European Breeding Bird Atlas 2 (EBBA2)
A New European Breeding Bird Atlas EBBA2 is an exciting new challenge for European ornithology providing vital data for conservation. It will document changes in the breeding distribution of all European bird species.
EBBA2 covers 5 years of fieldwork in more than 50 European countries, including the European part of Russia, Caucasus, and Turkey, 2013, and 2017.

PanEuropean Common Bird Monitoring Scheme (PECBMS)
The main goal of the PanEuropean Common Bird Monitoring Scheme (PECBMS) is to use common birds as indicators of the general state of nature using large-scale and long-term monitoring data on changes in breeding populations across Europe.
See the last update of trends and indicators.
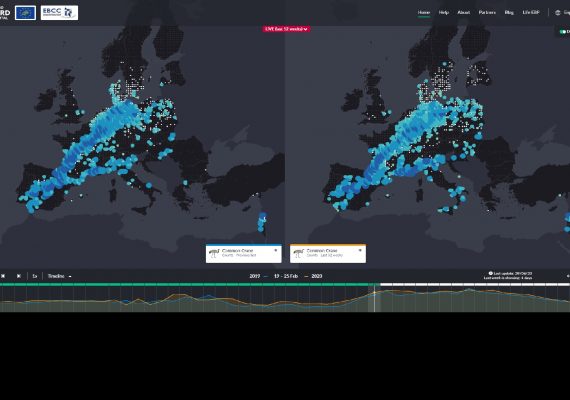

European Bird Portal (EBP)
The purpose of the European Bird Portal is to establish a European data repository based on aggregated data from online bird recording portals from across Europe.
Mobilizing 100,000 volunteer birdwatchers and 50 million new bird records every year to unravel European-wide spatiotemporal patterns of bird distribution.