50 years of Sovon
March 14, 2023 | alena.klvanova

Whether it’s the magic of a distribution map, the message behind the trends, the higher purpose of conservation or simply the drive to understand more about bird behaviour through targeted field observations, when counting birds, it is ultimately about the numbers. The number of people counting birds increased in the 1970s, and cooperation between birdwatchers became more intensive, partly due to the foundation of Sovon in 1973. As a result, it became increasingly important to better coordinate the counting efforts. Standardised counting guidelines would improve the comparability of bird numbers between years and areas. Certain initiatives were particularly important in establishing guidelines, such as the structured migration counts initiated by the national workgroup for migration counts (Landelijke Werkgroep Vogeltrek Tellen) and the publication of the bird inventory handbook (Vogelinventarisatie) in 1985. This book discussed all counting methods, particularly for monitoring breeding birds, and incorporated studies that were carried out to test the probability of observing the present bird species during surveys. The results were a fundamental part of the first counting manual of the Breeding Bird Monitoring Project (BMP) in 1984. The extensive information and methods described in the handbook still form the basis of the monitoring network today.
Monitoring projects
Many developments have taken place since we first started coordinating monitoring bird populations. A continuous demand to gather information and answer questions for scientific, conservation or policy purposes calls for new methods and approaches. Nowadays, there is also a need for more specific trends, zooming in from the national level to provinces and even local regions. Besides that, the motivations, wishes and time investment of volunteers also change. In order to allow birders with little time to participate, low-threshold entry-level projects have recently been initiated to attract new volunteers: the year-round garden bird survey (Jaarrond Tuintelling) and LiveAtlas. Despite the fact that monitoring benefits from long-term continuity to keep the results comparable, it is clear that a lot of changes have taken place. In the 1990s, the monitoring guidelines were further refined and restricted in order to improve standardisation. Additional breeding monitoring projects were established to generate reliable trends for as many species as possible. Later on, new, low-threshold counting projects were successfully launched for habitats where the monitoring of breeding birds was not as self-evident, in urban areas (Monitoring Network Urban Species (MUS)) and open agricultural areas (Monitoring Network Agricultural Species (MAS)). For these projects, an approach was chosen that was first introduced for the second breeding bird atlas with less time-consuming point counts, carried out at preselected random locations.
Dynamic populations
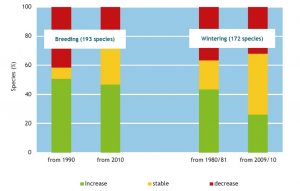
Dutch bird populations are extremely dynamic. Since 1980, only a minority of water- and wintering birds have shown stable trends; for breeding birds, very few have been stable since 1990. For wintering birds, fewer species have shown positive trends since 2010, of which terrestrial species fare worse than waterbirds. For breeding birds, more species are increasing than decreasing, which is especially pronounced in the shorter term (i.e. the last 12 years).
An example of such a decline is the Spotted Redshank. Numbers of this species peak during migration from July to September. In these months, a maximum of 2,500 birds are present in the Netherlands, mostly concentrated on the inter-tidal areas of the Wadden Sea, where the Dollard is traditionally the most important area. This is also where the largest decline is seen. The Dollard estuary is polluted by the large amounts of fertilisers that are used by nearby intensive livestock farms, which negatively affects the abundance of amphipods, the primary prey species for Spotted Redshanks.
Counting all species wherever you go, year-round
The analysis of counting data is developing rapidly. Nowadays, monitoring data is often supplemented with that of semi-standardised censuses, such as the so-called lists collected with the LiveAtlas project. Until recently, there were only two ways of reporting bird numbers: opportunistic observations (ad hoc records) and counts collected through strict monitoring protocols such as the Breeding Bird Monitoring Project. However, not all observations are equally valuable for providing insights into bird trends and distributions. With the LiveAtlas, we are now collecting more observations via lists in which the observer ticks all the species they have seen and, if possible, also counts them. This method is based on the fieldwork used to create the Dutch Bird Atlas (Vogelatlas, 2018), in which observers kept a complete list of species observed within one fixed square km.
Complete lists
Complete lists have the important added value over ad hoc records that they distinguish between ‘present’ and ‘not present’. This allows the chance of encountering a species to be determined and better comparisons across time periods to be made, for example, between years. The listing structure makes them easy to combine with data from the monitoring networks during analyses. As such, the complete lists provide a welcome addition because they can improve the trends of scarce species in poorly sampled regions. Moreover, they are very suitable for mapping bird movements, for example, via weekly distribution maps. Spectacular maps of such movements can be found on the website eurobirdportal.org, which is based on several databases, including that of Sovon. Complete lists, in addition to collecting monitoring data, are becoming an increasingly important data source, and this method also has a lot of potential beyond the Netherlands.
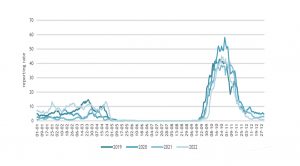
Seasonal pattern of Brambling between 2019 – 2022. The graph shows the percentage of complete lists on which the species was recorded. The daily encounter probability is calculated based on the average of the previous seven days (LiveAtlas).
Combining data
In the future, detailed bird counts and somewhat simpler methods for the lists will be combined more often to create the best possible distribution maps of birds throughout the year. The lists provide information about migration patterns and may also be useful in determining population trends of many migratory species that cannot be properly monitored with other projects, e.g. migrating Crossbills or the departure of Garden Warblers in autumn. Until recently, there was no year-round overview of many species, especially when it comes to migratory birds. This information is important for determining important stopover areas as well as the conservation status of many more species than is currently possible. Altogether, LiveAtlas and this method of counting could give us much more information about the ups and downs of all bird populations occurring in the Netherlands.
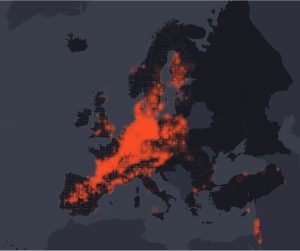
Example of a joint display of monitoring data, complete lists and casual observations for the Common Crane in early November 2022 in Europe. The distribution of this species can be followed live on eurobirdportal.org.
The mixed fortunes of terns
Sandwich Terns and Common Terns have many similarities. In the Netherlands, both species breed mainly along the North Sea coast and in winter along the west coast of Africa. In addition to their ecology, they share a troubled past with persecution, loss of breeding grounds, poisoning and, most recently, highly pathogenic avian influenza influencing their populations. The long-term figures show both misfortune and prosperity.
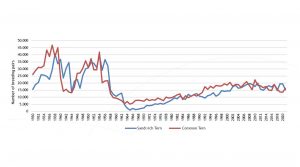
In 1910, the number of Sandwich Terns in the Netherlands reached a low point, with only about 500 pairs remaining from the 16,000 pairs just ten years earlier. Around the same time, the number of Common Terns also dropped to a low of about 12,500 pairs. The eggs of both species were frequently collected by people for food, and the birds were hunted for their feathers to decorate lady’s hats, a trend that emerged at the end of the nineteenth century. The 1907 annual report of the then recently established Dutch Society for the Protection of Birds states how hunters sailed back and forth in boats off the coast of Texel to shoot terns and sell them for 11 cents each. In 1908, terns were designated as protected birds by Minister Talsma, which helped to protect the colonies. The passing of the first Bird Act in 1912 ended the collectors’ raids, and the populations started growing again.
Collecting eggs and disturbance during World War II
In the 1920s and 1930s, the Sandwich Tern population grew to a peak of over 40,000 pairs (in 1938). About 70% of the European population bred in the Netherlands at that time. Common Terns also prospered in those decades. However, when the Second World War started, conservation measures were abandoned, and despite the ban on collecting eggs, both occupying forces and the island residents began to collect eggs en masse. Few nests were spared in the colonies of Griend, the Frisian Mokkebank and Texel. But that was not all, the German troops also caused considerable damage to breeding grounds when they constructed the Atlantic Wall (Atlantikwall). By the end of the war, the populations of both tern species had been roughly halved.
Want to know more about the fortune of the Dutch terns? Or read more in-depth articles? Download The State of the Netherland’s birds here: https://pub.sovon.nl/pub/publicatie/21288.
Marwa Kavelaars, SOVON
Famous colony of Sandwich Terns at De Beer, June 1948. Photo: Frans P. J. Kooijmans
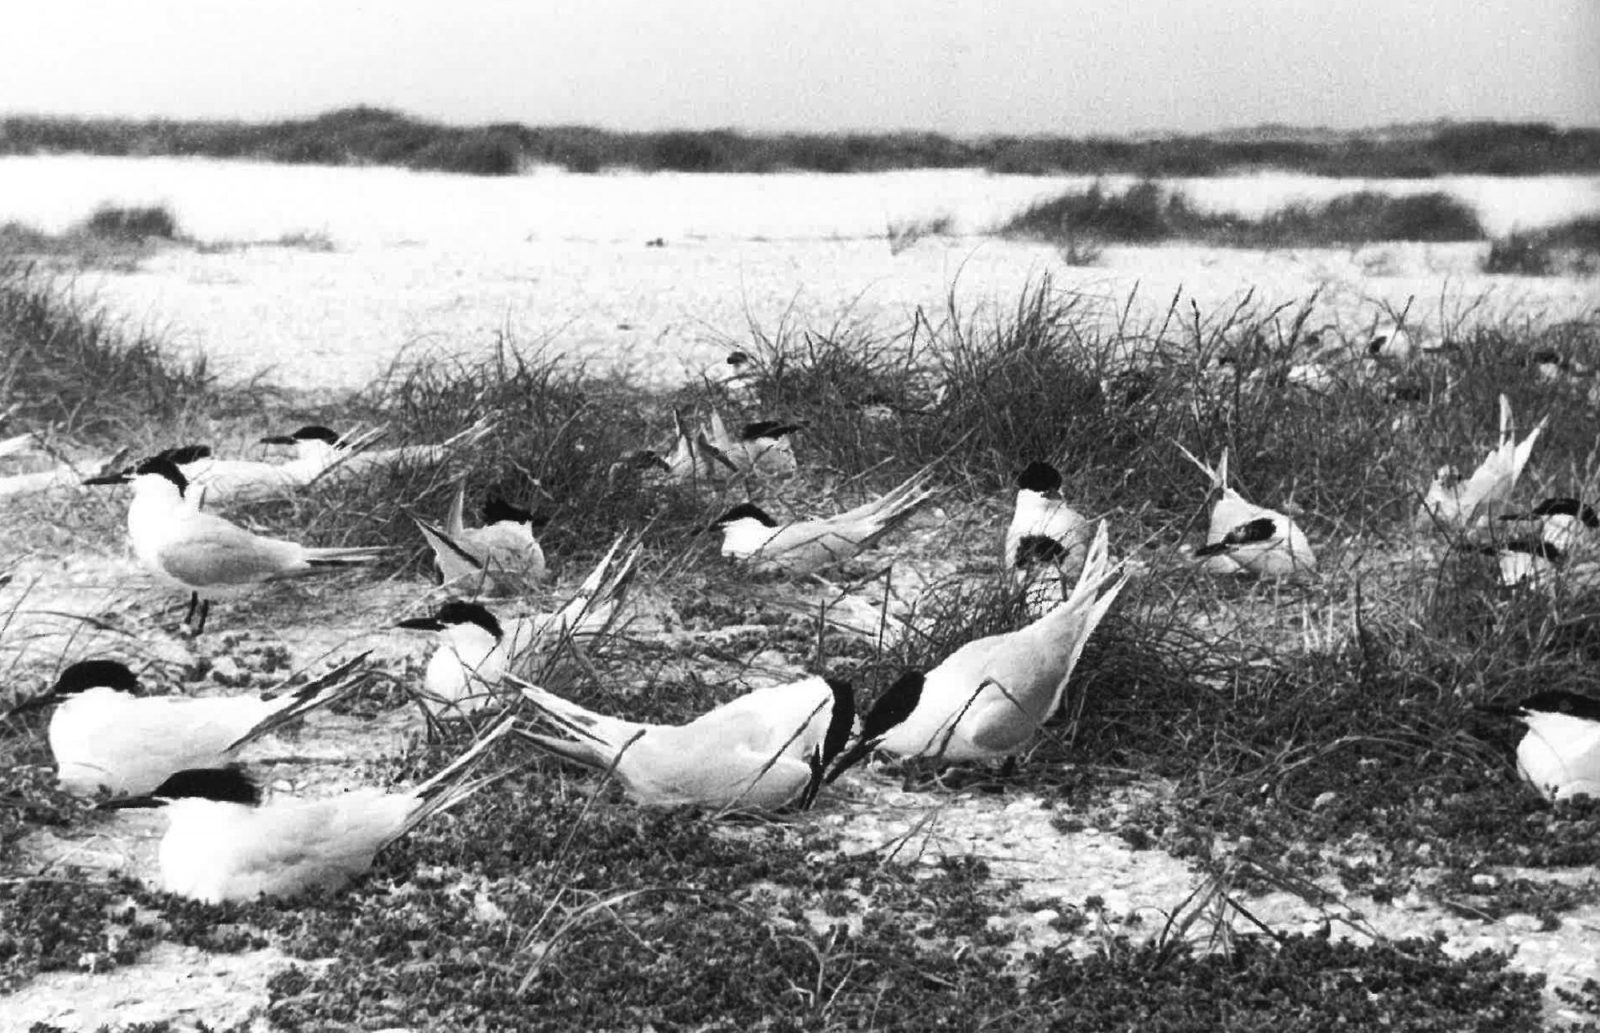
Famous colony of Sandwich Terns at De Beer, June 1948. Photo: Frans P. J. Kooijmans